
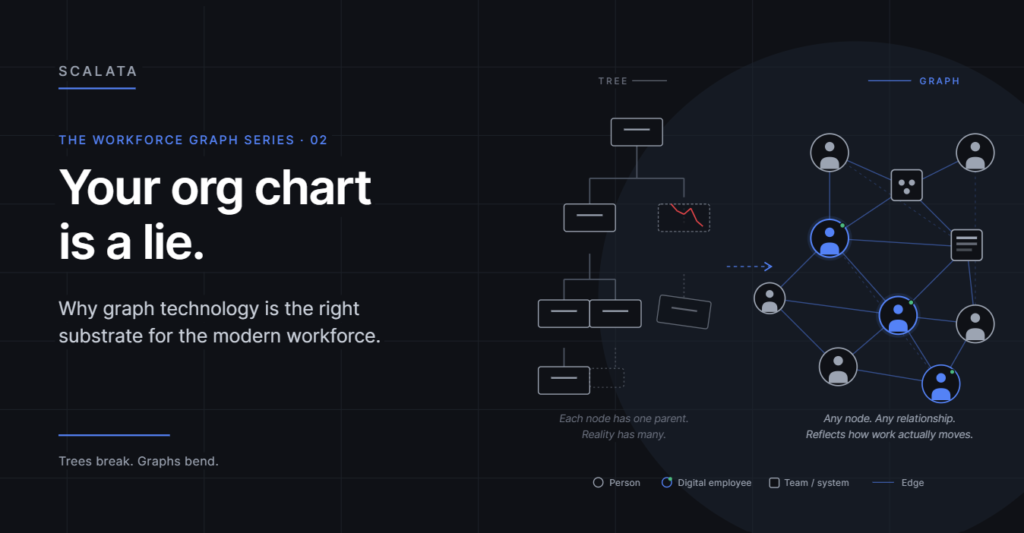
Every company has an org chart. Almost no company actually runs on it.
The real business — the one that ships product, closes deals, and handles customers — runs on a messy web of dotted lines, Slack DMs, shared inboxes, cross-functional projects, and “just ping Sarah, she knows.” The tree-shaped org chart on page three of the onboarding deck captures maybe 20% of how work actually moves. The other 80% lives in people’s heads, in Slack threads that scroll out of memory, in calendars, in the tribal knowledge of whoever’s been at the company longest.
This was a tolerable fiction when work was done by humans who could route around it. Humans are extraordinarily good at improvising organizational structure on the fly — we fill in the gaps, we ask around, we figure it out. The org chart can be wrong and the company can still function, because the people are compensating.
It becomes a very expensive fiction the moment you start adding digital employees to the mix. Digital employees can’t improvise the way humans do. They need the structure to be real. If the structure is a lie, the digital employees either fail, or worse, they succeed at the wrong thing.
Trees break. Graphs bend.
The org chart is a tree: each node has one parent. It’s clean, it’s printable, it fits on a slide. It’s also structurally wrong for how a business operates.
Consider a single piece of work — say, a new customer onboarding. It touches sales, solutions engineering, finance, legal, customer success, and product. It depends on a CRM, a billing system, a provisioning pipeline, and three shared docs. The people involved report to four different VPs. The timeline is driven by the customer, not by any one team’s cadence. No tree can represent this. Every company solves it the same way: they don’t. They let the information live in the heads of the people doing the work, document it in a runbook that goes stale within a quarter, and hope that the person who “just knows how it works” doesn’t leave.
A graph can represent it. Graphs are built for exactly this: arbitrary nodes with arbitrary relationships between them. A person can belong to a team and a guild and a cross-functional project. A digital employee can report to a human manager, pull work from a queue owned by another team, and write to a system owned by a third. A workflow can cross six departments without losing coherence, because the graph doesn’t care about departments — it cares about the actual edges between actual nodes. The graph just keeps adding edges.
This isn’t a stylistic choice. It’s the difference between a model that fits reality and a model that doesn’t. Trees force you to lie about how your business works. Graphs let you describe it honestly.
What you actually model in a workforce graph
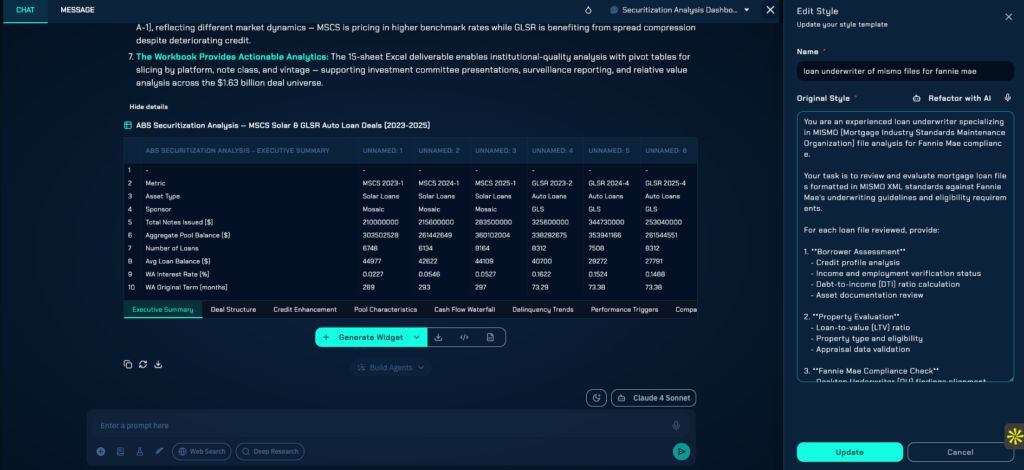
At Scalata, the graph has a handful of core node types:
- People — your human workforce, with their roles, skills, reporting lines, and areas of ownership.
- Digital employees — person-agents with identities, skills, and permissions of their own. They’re first-class citizens, not attachments.
- Teams — logical groupings that cut across the strict hierarchy. A team can have humans and digital employees in it. A person can be in multiple teams.
- Tasks — discrete units of work that get created, assigned, worked on, and completed. Every task is a node you can inspect, route, and report on.
- Workflows — sequences of tasks with triggers, conditions, and handoffs. A workflow is a live structure in the graph, not a diagram on a wiki.
- Tools and systems — the CRMs, ERPs, data warehouses, and apps the workforce touches. They’re nodes too, because access to them is a relationship that matters.
The edges between these nodes are where the value lives. Reports to. Owns. Depends on. Triggers. Has access to. Escalates to. Collaborates with. Backs up. Every edge is a fact about how your business runs, made explicit and queryable. The set of all these facts is your operating model — not in a document, but in a structure you can reason about.
The superpower: you can ask the graph questions
Spreadsheets and org charts are static. A graph is interrogable. This is the unlock that changes how you operate.
Once your workforce lives in a graph, you can ask things you simply can’t ask today:
- If this digital employee fails, what work stops moving and who gets paged?
- Which humans are bottlenecks because too many workflows depend on them?
- Where are we paying humans to do work that a digital employee already handles for another team?
- If we reorganize, which handoffs break, and which workflows need redesigning before the reorg takes effect?
- What’s the fastest path from a customer request to a resolved ticket, and how many nodes does it cross?
- Which digital employees have access to customer PII, and what are the escalation paths for each of them?
- If we remove this team entirely, what work orphans, and what’s the cost to absorb it elsewhere?
These are strategic questions about how your company works. A graph lets you answer them with data instead of guesswork. Most companies today can’t answer any of them — they’d need to interview a dozen people, triangulate the answers, and hope nobody lied out of self-preservation. A graph-based workforce answers them in a query.
This is the operational analog of what data warehouses did for business intelligence. Before Snowflake and BigQuery, you couldn’t really ask questions about your data — you had to commission a report, wait for it, and hope the answer was still relevant. Graphs do the same thing for organizational structure. You stop waiting for the answer. You just ask.
How Scalata does this — and why most others can’t
A lot of vendors will claim they “support” digital employees, or that their workflow tool is “graph-like.” Almost none of them actually run on a graph as the primary substrate. The difference matters more than it sounds.
Most agent platforms are flowchart engines underneath. You define triggers, you wire up actions, you connect them with arrows. It works for one workflow at a time, in isolation. It doesn’t work when you need to ask “what depends on what” across the whole organization, because the underlying data model can’t represent it. Each workflow is a silo. Cross-workflow questions are unanswerable.
Scalata is built differently. The graph isn’t a feature; it’s the foundation. That has consequences other platforms can’t replicate without rebuilding from scratch:
- Compliance becomes queryable. Regulated industries — finance, healthcare, insurance, government — don’t just need to be compliant; they need to prove compliance, on demand, to auditors who don’t accept “trust us.” When your workforce structure lives in a graph, audit-grade questions become single queries. Show me every digital employee with access to PHI, the human who manages it, and the last 90 days of activity. Done. With flowchart-based platforms, that question takes weeks of forensic work.
- Change management is structural. When a regulation changes — a new data residency rule, a new approval threshold, a new disclosure requirement — you change the graph and every digital employee that touches the affected edge updates immediately. With most other platforms, you have to find every workflow that might be affected, edit each one, test each one, redeploy each one. The time-to-comply is weeks instead of minutes.
- Cross-functional visibility, by default. A graph naturally crosses departments. Most agent platforms are deployed team-by-team, which means every team has its own islands of automation, with its own conventions and its own blind spots. Scalata gives the CIO, the COO, and the CCO a single view across the entire organization, because they’re all looking at the same graph.
- No vendor lock-in inside your own org. Companies who deploy multiple agent vendors end up with a Frankenstein workforce: each vendor has its own console, its own log format, its own permissions model. Nothing aggregates. Scalata’s graph is the layer where everything aggregates — including, where appropriate, third-party agents brought in as nodes alongside Scalata-native ones.
- Designed for the controls regulated buyers actually need. SOC 2, ISO 27001, HIPAA, GDPR, region-locked data handling, role-based access control with separation of duties, immutable audit trails — none of this is a checkbox add-on at Scalata. It’s a property of running on the graph. Most agent platforms can technically support these controls; very few make them effortless.
This is why enterprises in regulated sectors are choosing Scalata over more general agent tooling. It’s not that the agents are necessarily smarter (the model layer is increasingly a commodity). It’s that the substrate is built for the way regulated, complex businesses actually operate — and the substrate is the part that’s hard to change once you’ve picked the wrong one.
Why now
Graph technology has been around for decades — it’s what powers social networks, fraud detection, and knowledge bases. The theory is settled. The tools are mature. What’s new is the arrival of capable AI agents that can become nodes in the graph. Once a digital employee is a first-class entity alongside a human one, the graph stops being a diagram of your company and starts being its operating layer.
That’s the shift. Five years ago, modeling your workforce as a graph would have been a nice-to-have analytics exercise. Today, it’s the only sensible way to integrate AI workers into a business. Without the graph, every digital employee is a one-off integration. With it, they’re members of the workforce.
This also means the work of building the graph isn’t overhead — it’s strategy. Companies that invest in getting their workforce graph right now will be able to deploy digital employees faster, govern them more tightly, and evolve them more fluidly than competitors who skip this step. Companies that don’t will be stuck bolting agents onto a fictional org chart, and the results will be exactly as coherent as that sounds.
That’s the bet behind Scalata: the workforce graph isn’t documentation. It’s infrastructure. The companies that treat it that way will operate differently — and better — than the ones that don’t.
Next in this series: what it actually looks like to map tasks and workflows across a hybrid team of people and person-agents, and why the handoff is where most digital-employee deployments either succeed or quietly fall apart.
