Perspective
Your Org Chart Is a Lie: Why Graph Technology Is the Right Substrate for the Modern Workforce
 Your Org Chart Is a Lie
Your Org Chart Is a Lie
Why Graph Technology Is the Right Substrate for the Modern Workforce
Every company has an org chart.
Almost no company actually runs on it.
The real business—the one that ships products, closes deals, and serves customers—runs on a messy web of dotted lines, Slack DMs, shared inboxes, cross-functional projects, and conversations that begin with:
"Just ping Sarah. She knows."
The tree-shaped org chart on page three of the onboarding deck captures maybe 20% of how work actually moves.
The other 80% lives inside people's heads, Slack threads that disappear into history, calendars, and the institutional knowledge of whoever has been at the company the longest.
This was a tolerable fiction when work was done entirely by humans.
Humans are extraordinarily good at improvising organizational structure.
We fill in the gaps.
We ask around.
We figure it out.
The org chart can be wrong and the company still functions because people compensate.
It becomes a very expensive fiction the moment you begin adding digital employees.
Digital employees cannot improvise.
They need the organizational structure to be real.
If the structure is a lie, the digital employees either fail—or worse, they succeed at the wrong thing.
Trees Break. Graphs Bend.
 Workforce Graph Foundation
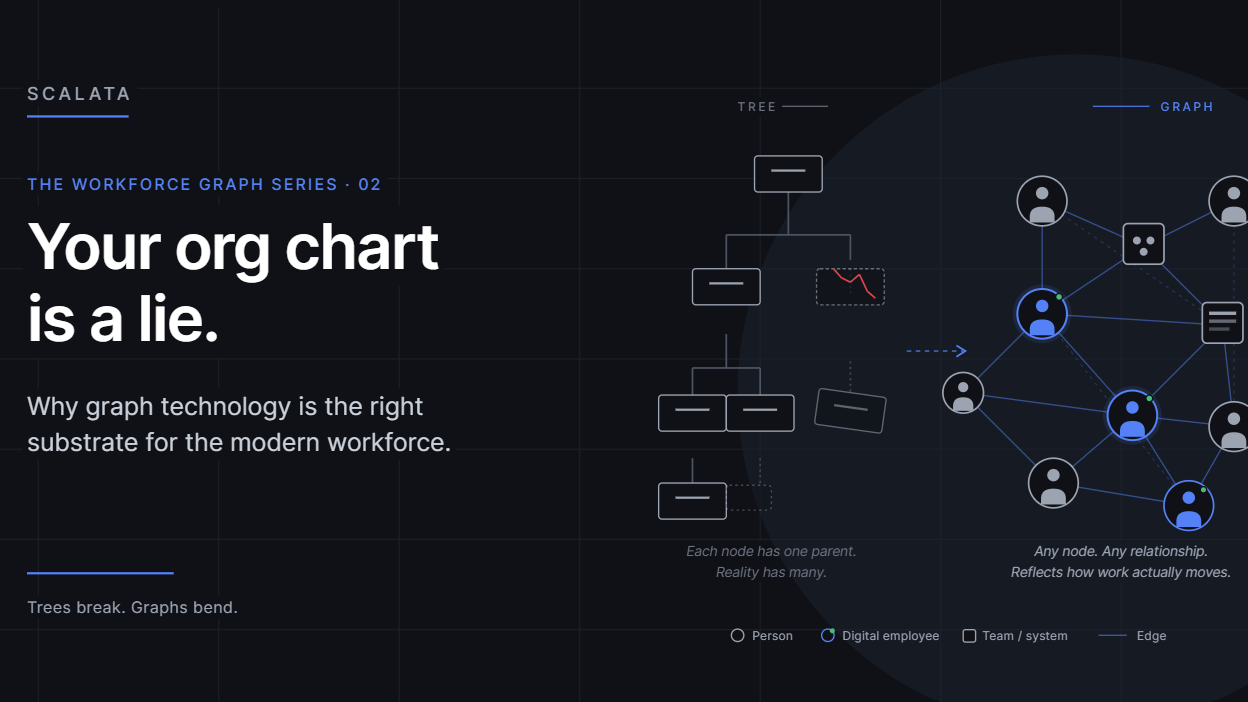
The org chart is a tree.
Each node has one parent.
It is clean.
Printable.
Easy to fit on a slide.
It is also structurally wrong for how businesses actually operate.
Consider a single customer onboarding.
It touches:
- Sales
- Solutions Engineering
- Finance
- Legal
- Customer Success
- Product
It depends on:
- CRM systems
- Billing platforms
- Provisioning pipelines
- Shared documentation
The people involved report to different executives.
The timeline is driven by the customer—not by any individual department.
No tree can accurately represent this.
Most organizations simply avoid solving the problem.
Knowledge remains inside people's heads.
Runbooks become outdated.
Critical processes depend on whoever "just knows how it works."
A graph models it naturally.
Graphs are designed for arbitrary nodes connected through arbitrary relationships.
A person can belong to multiple teams.
A digital employee can report to one manager, perform work owned by another team, and interact with systems managed somewhere else.
A workflow can span six departments without losing coherence because graphs model relationships—not hierarchy.
The graph simply keeps adding edges.
This isn't a stylistic preference.
It's the difference between modeling reality accurately and forcing reality into a model that doesn't fit.
Trees force organizations to simplify how work happens.
Graphs describe how work actually happens.
What You Actually Model in a Workforce Graph
 Workforce Graph Model
At Scalata, the workforce graph is built around several core node types.
People
Your human workforce, including:
- Roles
- Skills
- Reporting relationships
- Ownership
Digital Employees
Person-agents with their own:
- Identity
- Permissions
- Capabilities
They are first-class members of the workforce—not simply automation attached to a workflow.
Teams
Logical groups that extend beyond organizational hierarchy.
Teams may include both humans and digital employees.
Individuals can belong to multiple teams simultaneously.
Tasks
Individual units of work that are:
- Created
- Assigned
- Executed
- Completed
Every task becomes its own inspectable node.
Workflows
Sequences of tasks connected by:
- Triggers
- Conditions
- Handoffs
Unlike static diagrams, workflows exist as live structures inside the graph.
Tools and Systems
CRMs, ERPs, data warehouses, and enterprise applications also become graph nodes because access relationships matter.
The relationships between these nodes are where the real value exists.
Examples include:
- Reports to
- Owns
- Depends on
- Triggers
- Has access to
- Escalates to
- Collaborates with
- Backs up
Each relationship becomes an explicit, queryable fact describing how the organization actually operates.
Together these relationships form the company's operating model—not inside documentation, but inside a structure software can reason about.
The Superpower: You Can Ask the Graph Questions
Spreadsheets and org charts are static.
Graphs are interrogable.
Once your workforce exists inside a graph, entirely new operational questions become possible.
For example:
- If this digital employee fails, what work stops and who gets notified?
- Which people are organizational bottlenecks because too many workflows depend on them?
- Where are humans performing work already handled by digital employees elsewhere?
- If the company reorganizes, which workflows break first?
- What is the fastest path from customer request to resolution?
- Which digital employees currently have access to customer PII?
- If an entire team disappeared tomorrow, what work becomes orphaned?
These are strategic operational questions.
Most organizations cannot answer them today without interviewing dozens of people.
A workforce graph answers them through queries.
This is the operational equivalent of what modern data warehouses did for business intelligence.
Instead of commissioning reports and waiting for answers, organizations simply ask the graph.
How Scalata Does This — And Why Most Others Can't
Many vendors claim to support digital employees.
Many describe their workflow platforms as "graph-like."
Very few actually use a graph as the underlying operating model.
The distinction matters.
Most agent platforms are fundamentally flowchart engines.
Triggers connect to actions.
Actions connect through arrows.
That works for isolated workflows.
It breaks down when organizations need to understand dependencies across the entire business.
Each workflow becomes another silo.
Cross-workflow reasoning becomes impossible.
Scalata is built differently.
The graph is not a feature.
It is the foundation.
That foundation enables capabilities other platforms cannot easily reproduce.
Compliance Becomes Queryable
With a workforce graph, audit questions become graph queries.
For example:
Show every digital employee with access to regulated customer information, identify the responsible manager, and display all activity over the past ninety days.
Instead of weeks of forensic investigation, the answer becomes immediate.
Change Management Becomes Structural
When regulations change, organizations update the graph once.
Every affected digital employee inherits those changes automatically.
Traditional workflow systems require locating, editing, testing, and redeploying every affected workflow individually.
Cross-Functional Visibility
Graphs naturally span departments.
Executives gain one unified operational view instead of disconnected automation islands.
No Vendor Lock-In Inside Your Organization
Companies increasingly deploy multiple AI vendors.
Scalata's workforce graph becomes the common operating layer—even across third-party agents.
Built for Regulated Enterprises
Capabilities including:
- SOC 2
- ISO 27001
- HIPAA
- GDPR
- Region-specific data residency
- Role-based access control
- Separation of duties
- Immutable audit trails
are not bolt-on features.
They emerge naturally because everything operates through the graph.
This is why regulated enterprises increasingly choose workforce graphs over general-purpose agent platforms.
The intelligence layer is becoming commoditized.
The operating model is not.
Why Now
 Graph-Based Governance
Graph technology has existed for decades.
It powers:
- Social networks
- Fraud detection
- Knowledge graphs
What has changed is the arrival of capable AI agents.
Once digital employees become first-class participants alongside humans, the graph stops being documentation.
It becomes the operating layer of the organization.
Five years ago, workforce graphs were analytical tools.
Today, they are foundational infrastructure for organizations deploying AI workers.
Without the graph, every digital employee becomes another isolated integration.
With it, digital employees become members of the workforce.
Building the workforce graph is no longer overhead.
It is strategy.
Organizations that invest now will deploy digital employees faster, govern them more effectively, and evolve them more intelligently than competitors relying on static organizational charts.
Those that do not will continue attaching AI agents to organizational structures that never reflected reality.
The results will be exactly as coherent as those structures themselves.
That is the bet behind Scalata.
The workforce graph is not documentation.
It is infrastructure.
The organizations that recognize that distinction will operate differently—and better—than those that do not.
 Enterprise Workforce Graph
Next in this series: What it actually looks like to map tasks and workflows across a hybrid team of people and person-agents, and why the handoff is where most digital employee deployments either succeed or quietly fall apart.